The topic of the SharePoint BLOB Cache and how it operates jumped back into the front of my brain recently given some conversations I’ve had and things I’ve seen (e.g., a promising CodePlex project called the SharePoint 2010 BlobCache Manager).
SharePoint PSA
 This post is my way of doing something akin to a SharePoint public service announcement. I’ve recently seen some caching-related functionality and topics – especially the BLOB Cache – getting some real traction in different circles, and I think that the attention and love is generally a good thing. I am somewhat concerned, though, by the fact that the discussions and projects that have been surfacing don’t seem to say much beyond the Post-It on the right.
What do I mean by “Just do-it?” Well, here’s the high-level summary of what I’ve been seeing people say, post, and practice with the SharePoint BLOB Cache:
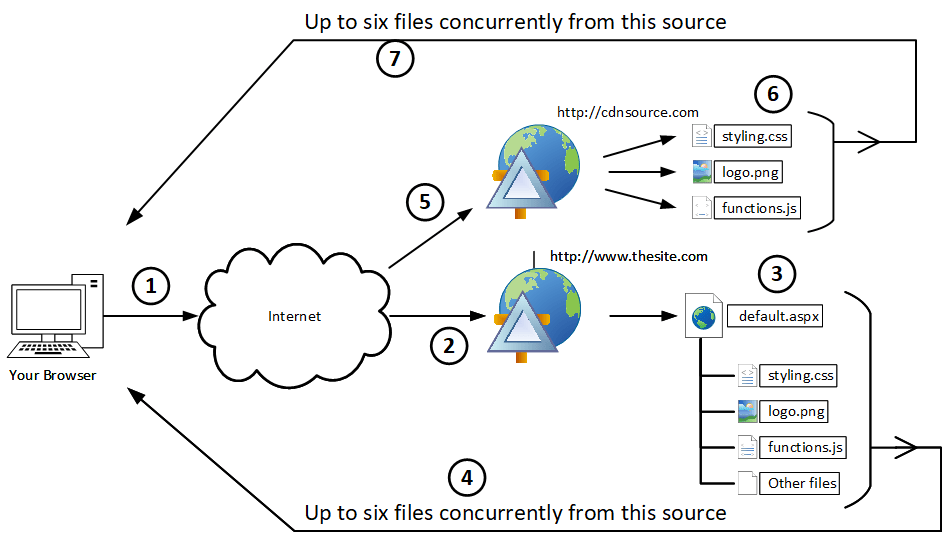
- The SharePoint BLOB Cache can lighten the load on your SQL Servers by caching BLOB (binary large object) data such as images, video, audio, CSS, etc., on your web front-ends (WFEs)
- BLOB assets are then served directly from the WFEs. This prevents regular round trips from the WFEs to SQL Servers for every BLOB item needed, and this conserves network bandwidth and reduces SQL Server load.
- To realize the benefits of the BLOB Cache, simply turn it on and you’re good to go. Nothing to it!
To be fair, I think that I’ve done a disservice by contributing to the perception that all you need to do to kick-start BLOB caching is change this web.config line …
[sourcecode language=”xml”]
<BlobCache location="C:\BlobCache\14" path="\.(gif|jpg|jpeg|jpe|jfif|bmp|dib|tif|tiff|ico|png|wdp|hdp|css|js|asf|avi|flv|m4v|mov|mp3|mp4|mpeg|mpg|rm|rmvb|wma|wmv)$" maxSize="10" enabled="false" />
[/sourcecode]
… to this:
[sourcecode language=”xml”]
<BlobCache location="C:\BlobCache\14" path="\.(gif|jpg|jpeg|jpe|jfif|bmp|dib|tif|tiff|ico|png|wdp|hdp|css|js|asf|avi|flv|m4v|mov|mp3|mp4|mpeg|mpg|rm|rmvb|wma|wmv)$" maxSize="10" enabled="true" />
[/sourcecode]
If you look closely, you’ll see that the only difference between the two XML elements is that the enabled attribute is changed from false to true in the second example.
As you might have guessed, I wouldn’t be writing this blog post if simply changing the BlobCache element’s enabled attribute to true didn’t cause potential problems.
The Small Print
At the recent SPTechCon in San Francisco, I gave a five-minute lightning talk called Pushing SharePoint’s ‘Go Faster’ Button. It was a lighthearted look at SharePoint performance, and it focused on a couple of caching changes that could be easily implemented to improve SharePoint performance. One of the recommended changes was (surprise surprise) to simply “turn on” SharePoint’s BLOB Cache.
I only had five minutes to deliver the lightning talk, so I had to cram all of the disclaimers for what I was recommending into the legal style slide that appears on the left. Although the slide got a chuckle from the crowd (the print did look pretty small on-screen), I actually did invest some time in its warnings and watch-outs for anyone who wanted to go and dig them up later.
Of the two tips I delivered in the lightning talk, Tip #2 dealt with the SharePoint BLOB cache. I included a very specific warning in the “Disclaimer of Liability” aimed at those who sought to simply “set it and forget it.” The text of that warning read:
Failure to specify a max-age attribute in the BlobCache element of the web.config will result in the default value of 86,400 seconds (24 hours) being used. Use of a non-zero max-age attribute will result in the attachment of client-side cacheability headers to assets that are being BLOB cached, and such headers can result in BLOB assets being cached on the client beyond the duration of the current user session; such caching can easily result in "stale" BLOB resources being used from the client rather than newer ones being fetched from the WFE, so adjust max-age values carefully.
Put another way: if you simply enable the BLOB cache and do nothing else, your users may be getting a SharePoint behavior change that you hadn’t intended for them to have.
Why Did You Have To Bring Age Into This?
The sticking point with SharePoint’s default BlobCache element and attribute settings is that a max-age of 24 hours is assumed and used when the max-age attribute isn’t explicitly specified or set. What does that mean? I wrote a separate post a while back titled Client-Server Interactions and the max-age Attribute with SharePoint BLOB Caching, and that post addressed the effect that explicit and implicit max-age attribute value specifications have on BLOB Caching. I recommend checking out the post for the full background; for anyone who needs a quick summary, though, I can distill it down to two bullet points:
- Enabling the BLOB Cache without specifying a max-age attribute means that BLOBs will be cached on both the WFEs in your farm and within users’ browser caches (through the use of Cache-Control HTTP headers).
- In collaboration environments and anyplace else where BLOB assets may be edited or turn over frequently (within the course of a day), the default client-side caching behavior can mess with the UI/UX of your SharePoint site in all sorts of interesting ways.
What does this mean for the average user of SharePoint? Well, let me walk through a fictitious scenario with supporting detail – as told from the perspective of a SharePoint end user. If you already understand the problem, you’re short on time, and you want to get right to what I recommend, jump down to the “Recommendations Before You Enable the BLOB Cache” section.
Acme Online Goes Live!
Welcome to the Acme Corporation! The Acme Corporation recently completed a “webification” of its entire product catalog, and the end result is a publishing site collection that is implemented in SharePoint 2010. The site collection houses all of Acme’s products, and those products are available for the public to browse and order. Acme’s web content management team is responsible for maintaining the product catalog as it appears on the site, and that team is led by a crafty old fellow named Wile E. Coyote (who we’ll simply refer to as “Wiley” from here on out).
Wiley has many years of experience with Acme’s products and has tried nearly all of them personally; he’s something of a legend. He and his team worked diligently to get Acme’s products into SharePoint before the launch. Not all of the products made it into SharePoint before the launch, though, so a phased approach was taken to rolling out the entire catalog.
The Launch
The first products that Wiley and his team worked to get into SharePoint were Acme’s line of explosives. To prepare for the launch of the new online catalog, Wiley wrote up an article on Acme’s top-selling “Bundle o’ Dynamite” product. The article featured a picture of the Bundle o’ Dynamite, along with some descriptive text about the product, how it operates, a few safety warnings, and a couple of other informational points. When Wiley finished, a mockup of the article page looked like the screenshot seen on the left.
Unbeknownst to Wiley, the Acme product catalog site collection is served-up by one Web application through one zone (the Default zone) on one WFE. This means that all product catalog requests, whether they come from customers or Wiley’s team, go to one IIS site on one server. The first time that someone (or more specifically, someone’s browser) requests the article page that Wiley put together, a series of web requests are kicked-off to pull down the page content, images, scripts, CSS, and everything else needed to render the page in a browser. This series of interactions (captured using Fiddler) is shown on the top right.
Subsequent requests for the same article page (within the context of a single browser session) will follow the series of interactions seen directly to the right. One thing that you may notice upon inspecting the Fiddler trace is that subsequent page requests result in fewer calls back to the server. This is because SharePoint applies per session caching to many of the items it passes back to the browser, and this caching (which is not the same as BLOB caching) removes the need for constant re-fetching of items that haven’t changed.
In both of the Fiddler traces above, the focus is on the newsarticleimage.jpg file – the file which houses a picture of the Bundle o’ Dynamite. The first time the browser requests the image within a session, a successful HTTP 200 response is returned to the browser along with the image. Also important to note is the Cache-Control header that comes back with the image:
[sourcecode language=”text”]
Cache-Control: private,max-age=0
[/sourcecode]
The private part of the Cache-Control header tells the client browser to cache the image locally for the duration of the browser session. The max-age=0 portion says, in effect, that subsequent uses of the image by the browser (from its cache) should be validated with a call back to the WFE to ensure that the image hasn’t changed.
And that’s what is shown happening in the second Fiddler trace. When subsequent page requests attempt to use the image, a GET request from the browser is answered by the WFE with
[sourcecode language=”text”]
HTTP/1.1 304 NOT MODIFIED
[/sourcecode]
This response code tells the browser that the image hasn’t changed and that it’s safe to use the locally cached copy. If the image were to change, then an HTTP 200 would be returned instead and the new/updated version of the image would be sent to the browser.
When the browser is closed, the locally cached copy of the image is flushed and the process begins anew the next time the browser opens.
Meep Meep
Not long after the launch of Acme’s online product catalog, customers began complaining that browsing the catalog was simply too slow. After some discussion, Management decided to bring in Roadrunner Consulting to assess the site and make suggestions that would improve performance.
Roadrunner’s team raced around (as they are wont to do), ran some tests, made some observations, and provided a list of suggestions. At the top of the list was “Implement SharePoint BLOB Caching.”
So, Acme’s SharePoint administrators jumped right in and turned on BLOB caching. Since the site is served up through a single IIS site (SharePoint zone), the admins set enabled=“true” in the BlobCache element of the site’s web.config file. No other changes were made to the BlobCache element.
So, what happened? Well, things got snappier! The administrators watching their back-end performance noticed that the file system on the WFE started to cache BLOBs that were being requested by users. Each request to the WFE for one of those BLOBs resulted in the BLOB being served back directly from the WFE without a round-trip to the SQL Server. Internal network bandwidth utilization dropped significantly, and the SQL Servers started breathing a bit easier. The administrators were most definitely happy with the change they’d made … and it was as easy as setting enabled=”true” in the BlobCache element of the web.config file. Talk about the greatest thing since sliced bread! Everyone exchanged a round of high-fives after the change was made, and talks of how the geeks would rise up to dominate the world resumed.
So, how do things look on the client side after enabling the BLOB Cache? Well, when someone goes to retrieve Wiley’s article for the first time, the first browser request series for the page looks much like it did without the BLOB Cache enabled. See the Fiddler trace on the right.
There is one very important difference when retrieving items with the BLOB Cache enabled, though, and you have to look closely to see it. Do you see the Cache-Control HTTP header that is returned with the request for the newsarticleimage.jpg image? It’s different than it was before the BLOB Cache was enabled. Now it says
[sourcecode language=”text”]
Cache-Control: public, max-age=86400
[/sourcecode]
Whoa … what does this mean? Well, it means two important things. First, the public designation means that when the image is cached by the browser, it will no longer be private to the current session. It can be re-used across sessions, so it won’t necessarily “go away” when the browser is closed.
Second, the max-age=86400 means that the image will continue to “live” in the browser’s cache for 86400 seconds, or 24 hours. For that period of time, the browser won’t even attempt to contact the WFE to see if the image has changed; it will just use the copy that it holds onto. Nothing short of a browser cache flush (which is manual intervention by the user) will change this behavior.
And that’s what we see with the Fiddler trace on the right. This trace represents what subsequent page requests look like for the next 24 hours. Notice that the newsarticleimage.jpg image doesn’t get re-requested or checked. There are no HTTP 304 response codes coming back, because the browser simply isn’t requesting the image; it’s using its cached copy.
Admittedly, the Fiddler trace will look a little different when the browser is closed and re-opened … but a re-fetch of the newsarticleimage.jpg file will not take place for a full 24 hours unless a user clears the browser cache.
What does this change in behavior mean for actual users of the site? Read on to find out …
Running Off the Edge of the Cliff
Shortly after the BLOB Cache changes were made, Wiley got an (unrelated) call from the Fulfillment Department. They were furious because they’d been getting all sorts of returns for the Bundle o’ Dynamite. The reason for the returns? It’s because Wiley put the wrong image in his article page!
Even though Acme sells a product called the “Bundle o’ Dynamite,” the actual product that ships is a barrel of TNT. Since the product image was wrong, customers were incorrectly concluding that they’d get several sticks of dynamite instead of a barrel, and this was rubbing many of them the wrong way. Who knew?
Wiley went out to SharePoint, checked the article that he wrote, and saw that he did indeed use a series of dynamite sticks for an image. The page should have actually appeared as it does in the screenshot that is above and to the left. After a quick facepalm, Wiley realized that he needed to make a change – and fast.
Wiley went out to the Publishing Images library for the site collection and uploaded a new version of the newsarticleimage.jpg image file – one that contained a barrel of TNT instead of a bundle of dynamite. He then browsed to the article page and did a refresh.
Nothing changed.
Wiley hit F5 in his browser. Still nothing changed.
Over the course of the hour that followed, Wiley grew increasingly more bewildered and panicked as he tried in vain to get the new TNT barrel to show up on the article page. He uploaded the image several more times, closed and re-opened his browser, deleted and then reloaded the image, re-published and re-approved the actual article page, and even got the administrators to flush the SharePoint BLOB Cache. None of the actions made a difference.
The Coyote Never Wins
Why didn’t any of Wiley’s efforts make a difference? Because what Wiley didn’t understand was that there was nothing he could do short of flushing his cache that would prompt the browser to re-request the updated image. The browser started using the cached copy of the image after the first request Wiley made in the morning; i.e., the request to verify that the image on the page was incorrect as Fulfillment indicated. For another 24 hours (86400 seconds), the browser would continue to use the cached image.
Wiley’s image problem was just one of the potential issues that might surface as a result of the BLOB Cache change. It was also one of the more visible problems. In looking at the path attribute of the BlobCache element, you might have noticed some of the other file types that got cached by default – file types with js (JavaScript) and css (Cascading Style Sheets) extensions, for example. Any of those file types which were served from site collection lists and libraries would also be impacted by the “fetch once and use for 24 hours” behavior.
Recommendations Before You Enable the BLOB Cache
I hope the example featuring Wiley did an adequate job of explaining why I think that blindly turning on the BLOB Cache can be a bad thing for end users. Having seen first-hand what an improperly configured BLOB Cache can do to the user experience, I’d like to offer up a handful of suggestions based on my own experience.
1. Don’t just “enable” the BLOB Cache with its out-of-the-box (OOTB) default settings. There are a couple of OOTB settings that you should really think hard about changing. I mentioned the default max-age value you get if you don’t actually specify the attribute value. I’m going to talk more about that one in a bit. Also: do you really want the BLOB Cache using your system drive (C:) as its target location for cached files? Most admins I know aren’t particularly friendly with that idea, so relocate the BLOB Cache to another drive.
2. If your Web application has only one zone (i.e., the Default zone), strongly consider specifying a max-age attribute value of zero (max-age=”0”). Why do I say this? Because it avoids the situation I described with Wiley above, and it’s a compromise that gives administrators some of the performance boosts they seek without completely shafting users in the process.
When the BLOB Cache is enabled and a max-age attribute value of 0 is explicitly specified, things change a bit. BLOB caching and offloading still happens on the WFEs, so administrators get the internal performance boosts they were probably seeking in the first place. On the other side of the equation (i.e., the “user side”), persistent client side caching ceases as shown on the left. Although the Cache-Control header still specifies public cacheability, the max-age=0 ensures that the browser will round-trip to the server each time it intends to use a locally cached resource to ensure that the most up-to-date copy of the resource is in the cache. This will keep users like Wiley from going off the deep end due to the wonky and inconsistent user experience that afflicts users who need to edit and proof a site that employs persistent client-side caching.
3. If you have a Web application that is extended to two or more zones, apply BLOB Cache settings that are appropriate for each zone. This is relatively common in public-facing SharePoint site collections and Web applications where anonymous access is in-use. In these particular scenarios, there are usually at least two SharePoint zones per Web application: an internal zone (typically the Default zone) through which editors and other users may authenticate to carry out content work, and an external zone (e.g., the Internet zone) which is set up for anonymous access and “external consumption.”
In this dual-zone scenario, it makes sense to configure each zone (IIS site) differently since usage patterns differ between zones. The BlobCache element in the web.config for the internal (Default) zone, for example, should probably be configured according to #2 (above – the one zone scenario with a max-age attribute value of zero). For the web.config that is used in the external zone, though, it may make sense to apply a non-zero max-age value for use with the BLOB Cache – especially since anonymous users aren’t (normally) content editors. A non-zero max-age means fewer trips (overall) to your WFEs from outside the LAN environment, and this helps to keep bandwidth utilization on your Internet connection. There is still a risk that external users may see “stale” content, but the impact is generally more acceptable for straight viewers since they aren’t actively working on content.
4. Consider changing the path expression to restrict what goes into the BLOB Cache. The default path expression for SharePoint 2010’s BlobCache element looks like this:
[sourcecode language=”text”]
\.(gif|jpg|jpeg|jpe|jfif|bmp|dib|tif|tiff|ico|png|wdp|hdp|css|js|asf|avi|flv|m4v|mov|mp3|mp4|mpeg|mpg|rm|rmvb|wma|wmv)$
[/sourcecode]
Most administrators are savvy enough to add and remove file extensions from this expression as needed; for example, taking |wmv out of the path expression means that the BLOB Cache will no longer store and serve files with a .wmv extension. Adding and removing extensions really only scratches the surface of what can be done, though. The path attribute value is actually a regular expression, so the full power of regular expressions can be applied to select and exclude files for use with the BLOB Cache.
Suppose you want to explicitly control which images, videos, and other files (that match the list of extensions) end up in the BLOB Cache? Maybe you want to specially name files you intend to cache with an additional .cache extension before the actual file type extension (e.g., .gif). To accomplish this, you could change the path expression to this:
[sourcecode language=”text”]
\.cache\.(gif|jpg|jpeg|jpe|jfif|bmp|dib|tif|tiff|ico|png|wdp|hdp|css|js|asf|avi|flv|m4v|mov|mp3|mp4|mpeg|mpg|rm|rmvb|wma|wmv)$
[/sourcecode]
With this path expression, filenames like these would be included in the BLOB Cache:
- SampleImage.cache.jpg
- MyVideo.cache.wmv
… but anything without the additional .cache qualifier would get omitted, such as:
- AnotherImage.jpg
- ExcludeThisVideo.wmv
This is just a simple example, but hopefully it gives you an idea of what you could do with the path regular expression to control the contents of the BLOB Cache.
Summing It Up
The SharePoint BLOB Cache is a powerful mechanism to improve farm performance and scalability, but it shouldn’t be turned on without some forethought and a couple of changes to the default BlobCache element attribute values.
If you are an administrator and have enabled the BLOB Cache with its default values, check with your users. They might have some feedback for you …
Additional Reading and Resources
- CodePlex: SharePoint 2010 BlobCache Manager
- Event: SPTechCon San Francisco 2012
- Prezi: Pushing SharePoint’s ‘Go Faster’ Button
- Blog Post: Client-Server Interactions and the max-age Attribute with SharePoint BLOB Caching
- Tool: Fiddler Web Debugging Proxy


 This brief exchange highlights one of the other points I try hard to make while speaking: PAY ATTENTION TO DATES! It’s not safe to assume (if it ever was) that something you read online will stay accurate and/or relevant indefinitely.
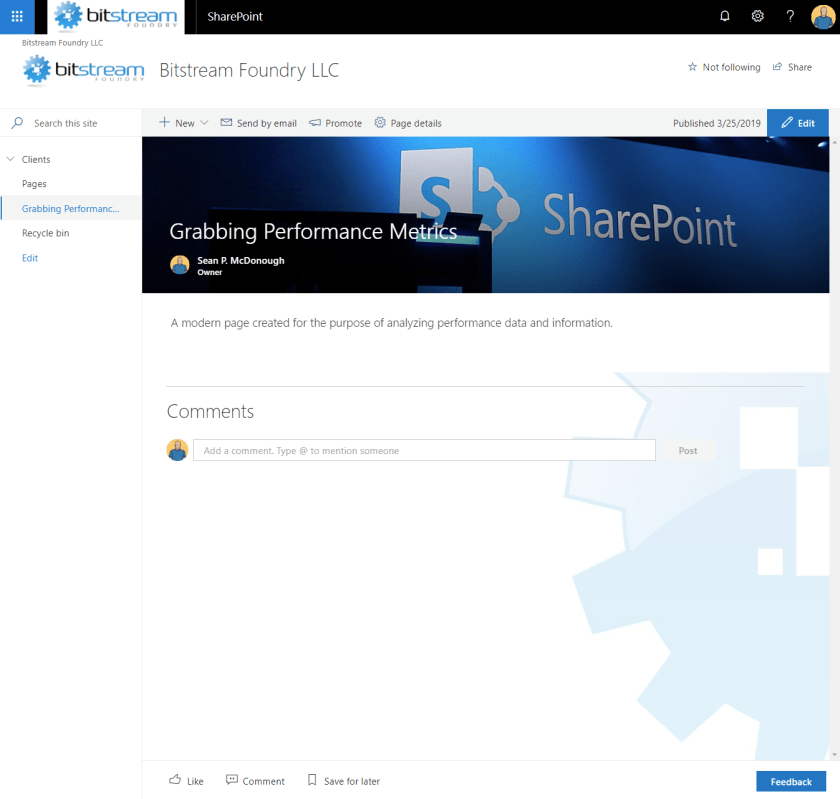


 I’m a big fan of leveraging caching to improve performance. If you look over my blog, you’ll find quite a few articles that cover things like implementing BLOB caching within SharePoint, working with the Object Cache, extending your own code with caching options, and more. And most of those posts were written in a time when the on-premises SharePoint farm was king.

 Scalability in the hardware and software space is all about


 This post is my way of doing something akin to a SharePoint public service announcement. I’ve recently seen some caching-related functionality and topics – especially the BLOB Cache – getting some real traction in different circles, and I think that the attention and love is generally a good thing. I am somewhat concerned, though, by the fact that the discussions and projects that have been surfacing don’t seem to say much beyond the Post-It on the right.


 I hope the example featuring Wiley did an adequate job of explaining why I think that blindly turning on the BLOB Cache can be a bad thing for end users. Having seen first-hand what an improperly configured BLOB Cache can do to the user experience, I’d like to offer up a handful of suggestions based on my own experience.