
UPDATE (3/20/2018): As most of you who have been following-along in your own tenants know, this issue wasn’t actually truly resolved last September. For a while, in some cases, it looked like the SPIisLatency and SPRequestDuration headers came back. But the victory was fleeting, and since that time I’ve continued to get comments from people saying “but I don’t see them!” And while I had the headers for a while in my tenant, I haven’t seen them in any predictable fashion.
The good news is that after much hounding and making myself a royal pain-in-the-tuckus to Bill Baer and others at Microsoft, it looks like we FINALLY have the right engineering and dev teams engaged to look at this. We got traction on it this week, with multiple repro scenarios and Fiddler traces being passed around … so I’m truly hopeful we’ll see something before long. Stay tuned!
UPDATE (9/2/2017): As I was preparing slides for my IT/DevConnections talks, I decided to check on the issue of the missing Page Response Headers (SPIisLatency and SPRequestDuration). I went through three different tenants and several pages, and I’m happy to report that the headers now appear to be showing consistently. My thanks to Microsoft (I’ll credit Chris McNulty and Bill Baer – I had been pestering them) for rectifying the situation!
“Why is it so slow?” That’s how nearly every performance conversation I’ve ever had begins.
No one likes a slow intranet page, and everyone expects the intranet to just “come up” when they pop the URL into their favorite browser. From an end-user’s perspective, it doesn’t matter what’s happening on the back-end as long as the page appears quickly when someone tries to navigate to it.
SharePoint Online is a big black box to many of its users and consumers. They don’t understand what it takes to build an intranet, nor should they have to. The only thing that really matters to them is that they can bring up a browser, type in a URL, and quickly arrive at a landing page. The burden of ensuring that the site is optimized for fast loading falls to the folks in IT who are supposed to understand how everything works.
If you’re one of those folks in IT who is supposed to understand how everything works with SharePoint Online but doesn’t, then this blog post is for you. Don’t worry – I know there’s a lot to SharePoint Online, but performing some basic troubleshooting analysis for slow pages in SharePoint Online is pretty straightforward. I’ll share with you a handful of techniques to quickly ascertain if the reason for your slow pages is due to the content within the pages themselves, if the issue is network-related, or if there might be something else happening that is beyond your control.
Your Toolset
The first step in your performance troubleshooting adventure begins by opening up your browser from a client workstation. Everyone has a favorite browser, but I’m going to use and recommend Internet Explorer for this exercise because it has a solid set of development tools to assist you in finding and quantifying performance issues. In particular, it is able to chronologically list and detail the series of interactions that take place between your browser and the SharePoint Online web front-ends (WFEs) that are responding to your requests.
When recommending IE, some people ask “how come you don’t use Fiddler?” It’s a good question, and when I first started showing people how to do some quick troubleshooting, I’d do so with Fiddler. If you’re just starting out, though, Fiddler comes with one really big gotcha: operating inside an SSL tunnel. To get Fiddler (which is a transparent proxy) working with SSL, there is some non-trivial setup required involving certificate trusts. Since this is intended to be a quick and basic troubleshooting exercise, I figure it’s better to sidestep the issue altogether and use IE (which requires no special setup).
The Setup
To make this work, let us assume that I am attempting to profile the Bitstream Foundry (my company) intranet home page in order to understand how well it works – or doesn’t. My intranet home page is pretty plain by most intranet standards (remember: I’m a developer and IT Pro – not a designer), but it’s sufficient for purposes of discussion.
Step 1. Open Your Browser
I start by opening Internet Explorer and navigating to the Bitstream Foundry intranet home page at https://bitstreamfoundry.sharepoint.com. Once I move past the sign-in prompts, I’m shown my home page:

My home page has very little on it right now (I’m still trying to decide what would go best in the main region), but it is a SharePoint Online (SPO) page and it does work as a target for discussion purposes.
Step 2. Access the Developer Tools
Accessing the developer tools within Internet Explorer is extremely simple: either press F12, or go to the browser’s gear icon and select F12 Developer Tools from the drop-down that appears as seen below:

Doing either of these will pop-open the developer tools as either a stand-alone window or as a pane on the lower half of the browser as shown below:

Step 3. PREPARE TO CAPTURE
When the developer tools first open, they’re commonly set to viewing the page structure on the DOM Explorer tab. For purposes of this troubleshooting exercise, we need to be on the Network tab so we can profile each of the calls the browser makes to the SPO WFE.
Select the Network tab and then select the “Always refresh from server” button as highlighted below in red.

The Network tab is going to allow us to capture the series of exchanges between the SharePoint WFE and our browser as the browser fetches the elements needed to render the page. The “Always refresh from server” button is going to remove client-side caching from the picture by forcing the browser to always re-fetch all referenced content – even if it has a valid copy of one or more assets in the browser cache. This helps to achieve a consistent set of timing values between calls, and it’s also going simulate someone’s first-time visit to the page (which typically takes longer than subsequent visits) more accurately.
Step 4: Capture the Exchange
The next step is to capture the series of exchanges between IE and SPO. To do this, simply refresh the page by pressing the browsers Refresh button, pressing , or going to the browser’s address bar and re-issuing the page request.
The contents of the window on the Network tab will clear, and as content begins to flow into the browser, entries will appear on the screen. For every request that IE makes of SharePoint Online, a new line/entry will appear. It will probably take a handful of seconds to retrieve all page assets, and it’s not uncommon for a SharePoint page to have upwards of 75 to 100 resources (or more) to load.

Strictly speaking, you shouldn’t have to stop the capture once the page has loaded, but there are several reasons why you would want to. First, you will eventually retrieve all SharePoint assets necessary to render the page. If you continue to capture beyond this point, you’ll see the number of requests (represented in the bottom bar of the browser – the number is 83 requests in the screenshot above) continue to tick up. It will slowly go up over time and it’s not due to the contents of the SharePoint page – it’s due to Office 365.
If you look at the last entry in the screenshot above, you’ll see that it’s a request to https://outlook.office365.com/owa. In short: this is due to a background process that allows Exchange to notify you when you receive new messages and calendar/event notifications. See how the Protocol and Result/Description columns indicate a (Pending) state?
If you get to this point and additional SharePoint elements are no longer loading, press the red “recording stop” button in the toolbar of Network tab. This will stop the capture. Not only does this help to keep the captured trace “cleaner,” but it also prevents excessive distortion of certain values – like overall time to load and the graphical representation of the page load (shown on the far right of the Network tab) as shown below.

Step 5: Find the SharePoint Page Request
At this point, you should have a populated Network tab with the entire dialog of requests that were needed to render your page. Of these requests, the overwhelming majority of them will be for JavaScript files (.js), cascading stylesheets (.css), and images (.png, .gif, and .jpg). Only one of them will be for the actual SharePoint page itself (.aspx) … and, of course, this is the request that you need to find in the list.
My intranet home page is named Home.aspx (as can be seen in the browser address bar), so I need to find the request for Home.aspx on the Network tab. I got lucky with this dialog attempt, because Home.aspx is the first entry listed. Note that this isn’t always the case, and it’s not uncommon to find your page request 10 or 20 down in the list.

When you locate the entry in the list for your .aspx page, click on it to select it. You can confirm that you’ve selected the right entry by verifying Request URL on the Headers tab to the right of the various requests listed for the exchange with SPO (highlighted in the image above).
Step 6: Analyze the Headers
At this point, we need to shift our focus to the HTTP Response Headers that are passed back with the content of the page. Much like the request headers that the browser sends to the server to provide information about the request being made, the response headers that are sent from the server supply the browser with all sorts of additional information about the page. This can include the size of the page (Content-Length), the payload (Content-Type), whether or not the page can be cached (Cache-Control), and more.
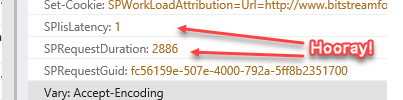
Making sure that you have the Headers tab selected, locate and record the three response headers as shown below:

The three values we want to record are:
- SPIisLatency. This is a measure of the amount of time (in milliseconds) that the request spent queued and waiting to be processed by IIS (Internet Information Services – the web server). Ideally, it should be zero or very close to zero. In my example, the SPIisLatency is 3ms.
- SPRequestDuration. This is the amount of time (again, in milliseconds) that it took to process the request on the server. Basically, this is the end-to-end processing time for the page. Healthy pages range from a couple hundred milliseconds to around a second depending on the content of the page. In my example, the SPRequestDuration is 249ms.
- X-SharePointHealthScore. This is the value, from zero to ten, that indicates how heavily loaded the SharePoint Server is at the time when the page was served. A score of zero means the server is not under load, while a score of ten means the server is overloaded. As the X-SharePointHealthScore goes up, the server begins to selectively suspend work designated as “low priority,” like some Timer Service jobs, Search requests, and various other low-priority tasks. ideally, this value should be zero – or close to it. In my example, the value is zero.
We can infer a great deal about the page processing and network traversal of our page request with just these three values and a final number.
A quick note (2017-07-06): For some reason, a variety of SharePoint Online sites have been returning pages without the SPIisLatency and SPRequestDuration headers lately. I don’t know why this is happening, and I’ve reached out to Microsoft to see if it’s a bug or part of some larger strategy. I don’t think it’s deliberate, because the headers provide some of the only insight end-users can get into SharePoint Online page performance. When I hear something from the product team, I’ll post it here!
The Magical Trio: SPIisLatency, SPRequestDuration, and Total Trip Time
So, you’ve now got three numbers – two of which are helpful for page profiling (SPIisLatency and SPRequestDuration), and a third number (X-SharePointHealthScore) which will tell you how stressed the server was when it served your page. What can you do with them? As it turns out, quite a bit when you combine two of the three with a fourth number.
What is the fourth number? It’s the total trip time that is reported for the page being loaded, and it represents the elapsed time from the point at which the page was requested until the time when the last byte of the page was delivered. For example, I profiled my Bunker Tuneage site. It’s a SharePoint Online site (yes, I know – I have to get it moved to another location soon), so it makes a good target for analysis:

In the above example, the three numbers we’re most interested in are:
- Total Trip Time: 847.47ms
- SPRequestDuration: 753ms
- SPIisLatency: 0ms
If we think about what the individual values mean, we can now reason that the total amount of time spent to get the page (847.47ms), minus the total amount of time spent waiting or processing the server (753ms), should be roughly equal to the amount of time spent “elsewhere” – either in routing, traversing network boundaries, on proxies and firewalls, etc.
So, considering our numbers above, the equation looks like this:

Based on our equation, this means that approximately (this isn’t exact) 94.47ms of time was spent getting from from the SharePoint Online server to our browser – not too shabby when we consider it.
The Permutations
The numbers could come out a variety of different ways when doing this, so it’s best if we try to establish a general trend. Variability between any two runs can be significant, so it’s in your best interests to conduct a number of runs (maybe a dozen) and come up with some average values.
Regardless of the specific values themselves, there are some general conclusions we draw about each value by itself – and when it is compared to the others.
- High Total Time. The total end-to-end times can vary dramatically. The examples I’ve got shown thus far demonstrate sub-second latency (i.e., hundreds of milliseconds), and any time you can get values like that, it’s nothing to complain about. When your total round trip time climbs to two or three seconds, your generally still doing pretty good. If you hit five, six, or seven+ seconds, it’s time to move on to what to see what SPRequestDuration, SPIisLatency, and the time-spent-elsewhere values say.
- High SPIisLatency. If you observe consistently high SPIisLatency values, they point to there being something wrong server-side, since a high SPIisLatency suggests that requests are backing up on the server. Although I’ve never seen it, I believe you could see high SPIisLatency for a brief period of time … but during that time, I’d also expect SharePoint Online to be spinning-up additional WFEs to deal with the effects of high user load. I’ve only ever seen SPIisLatency values in the single digits before, and they’ve never lasted beyond a request or two.
- High “Time Lost ‘Elsewhere.'” If you crunch the numbers in the performance equation and come up with a significant amount of time being lost “elsewhere,” it suggests that the traffic between SharePoint Online and your computer is being slowed down for some reason. It doesn’t specifically indicate what is causing the slowdown, but the slowdown could be due to any number of network conditions: excessive routing, web proxies, egressing to the Internet out-of-region (a form of excessive routing), firewall issues, or a whole host of other conditions. What represents “excessive” time spent elsewhere? Again, I can only speak to trends here, but I tend not to get too upset about anything under 1s (1000ms) being lost to other factors. When time lost elsewhere grows to be high – especially compared to SPRequestDuration – that’s when I get concerned. For example, an SPRequestDuration of 800ms with a time-lost-elsewhere value of 2500ms makes me wonder what’s happening between SharePoint Online and my computer.
- High SPRequestDuration. A high SPRequestDuration value can be caused by a variety of factors, and in truth the diagnosis tends to become a bit contentious. Since a high SPRequestDuration means that a page is taking a long time to process on the server, the most common response I frequently encounter (especially among those new to SPO) is that “there’s something wrong with SharePoint Online.” I hate to be the bearer of bad tidings, but repeat after me: “The problem isn’t with SharePoint Online, it’s with my site.” That 9000ms SPRequestDuration probably has very little to do with SPO and everything to do with how you customized SharePoint, your choice of navigation style, the fact that there are two dozen “expensive” web parts on the page, or something related to that. I’m not willing to rule out a problem with a SharePoint Online tenant, but in truth I have yet to encounter it.
What Can I Do About a High SPRequestDuration?
If you don’t believe me and instead feel that the problem is with the SharePoint Online environment, the good news is that there’s an easy way to tell one way or the other … and I highly recommend doing this before calling Microsoft Support (trust me, they’ll thank you for doing so).
Believe it or not, SharePoint Online is also where OneDrive for Business data is stored. A OneDrive for Business page, at its core, is a SharePoint page with nearly no customization. Using someone’s OneDrive for Business page becomes an excellent A/B test when the performance of SharePoint Online page is sub-par. Simply load up their OneDrive for Business page and compare performance numbers to the page in question.

Revisiting my Bunker Tuneage site example, you can see that the OneDrive for Business landing page is served from the same tenant as the earlier page. If I were to compare the SPRequestDuration value of the OneDrive for Business page (223ms) with the SPRequestDuration of the SharePoint page in-question (753ms), I’d note that the values differed … but are they different enough to think something is going awry in the SPO environment?
Roughly half a second (~500ms) is indeed a difference, but it’s not enough for me to think that the online environment has problems. When I see SPRequestDuration values like 9000ms for a SharePoint page but 500ms for OneDrive for Business page, that’s when I begin to suspect something is amiss. And again: with such an extreme disparity in values, SharePoint Online is healthy (500ms), but there’s clearly something wrong with my page (9000ms).
Practical Advice
When it comes to diagnosing the root cause or causes for high SPRequestDuration values, the good news is that there are plenty of fixes that range from the simple to the quite invasive. Microsoft has taken the time to compile some of the more common causes, and I highly encourage you to take a look if you’re interested.
At the end of the day, though, sometimes you just want to know where to begin troubleshooting so that you can focus remediation efforts. If you follow the steps outlined in this blog post, I think you’ll find that the five minutes they take to execute will help to focus you in the right area.
References and Resources
- MSDN: Discovering Windows Internet Explorer Developer Tools
- Company: Bitstream Foundry
- Telerik: Fiddler Web Debugging Proxy
- Fiddler: Decrypting HTTPS-protected traffic
- Mozilla Developer Network: HTTP Headers
- SPO Public Site: Bunker Tuneage Online
- Blog Post: Save Your SharePoint Online Public Site from the Chopping Block
- Office Support: Tune SharePoint Online Performance
Awesome.. Thanks for the valuable post.
Hey Sean, Really great write-up and I’ve already had success using this for an On-Prem solution. I’ve also tried using this process for SPO but with the Modern experience running I could not find SPIisLatency or SPRequestDuration. Is that an expected behavior with Modern experience?
Thanks for the feedback and comments, Jeff! To answer your question: the missing SPIisLatency and SPRequestDuration headers are something I’ve also noticed for a while now, but I don’t have an answer from anyone at Microsoft yet on why it’s occurring. As I noted in my post: I’m waiting to hear back from them (I’ve pinged them a couple of times), but as of yet … nothing.
I’m going to reach back out to them and see if I can find a way to escalate it. I’m also going to try on some other channels that I have available to me. As soon as I get a response and can confirm the information, I’ll post it here.
Jeff: I just updated my post to reflect the fact that it appears that Microsoft has resolved whatever issue was causing the SPIisLatency and SPRequestDuration response headers to disappear. I went through three separate tenants and looked at a variety of pages, and I see the headers on all of them. Just thought I’d let you know; hopefully the change has hit your tenant, as well!
Hi,
I am not getting the SPIisLatency and SPRequestDuration response headers on my Tenant either. I
Russell,
My understanding is that Microsoft fixed the issue and is rolling out changes to address it. It took some time for the headers to be added back to my tenant; perhaps your tenant(s) haven’t been updated yet?
– Sean
Hey Everyone! I want you to know that I’m once again failing to see the headers attached consistently, so I tried a different channel (https://techcommunity.microsoft.com/t5/SharePoint/SPIisLatency-and-SPRequestDuration-Response-Headers-in-SPO-Pages/m-p/122644#M10904) to get Microsoft’s ear on this. I’m picking on Bill Baer, but I don’t know that he’s even the right guy to point at. Stay tuned.
I can see SPIisLatency SPRequestDuration in both Chrome and Firefox dev tools, but not in either IE11 or Edge. FYI.
Thanks for the feedback, Keith. That’s flat-out … weird.
I’m still not seeing the headers on pages consistently if at all. I’ve spent some time with Bill Baer recently, and I know that he’s actively running it through the dev teams. I’ll probably ping him tonight or tomorrow to see if he’s made any progress. The reasons that the dev team was giving him for the behavior (initially) were a bunch of bunk – some garbage about web parts on a page. I laughed and told Bill that it’s happening on *blank* pages (no web parts), so that doesn’t fly. He agreed. Then they were having repro troubles. So I sent him a bunch of traces with full repro, so he thanked me and passed that along to them.
I’m like a dog with a bone, and I absolutely WILL NOT let this go until I get an explanation that’s satisfactory. Too bad for the devs ;-)
– Sean
I can’t see the headers SPIisLatency and SPRequestDuration. But do you know what the global javascript variables “g_latency” and “g_iisLatency” is reporting on? They are present on every page from what I can see, and by the names it looks like they are the same as the headers missing.
Opps, sorry, the first one was ofc “g_duration”
Thanks, I can confirm as of 13th September 2018 we too on our Tenant are not getting SPIisLatency and SPRequestDuration in the Headers
Thanks Scott – I appreciate the feedback. I know the issue continues to be an item which Microsoft is trying to get straightened out. It’s just not happening quickly. I’ve had tenants start showing the headers again … and others fall off. There’s no rhyme or reason to it right now.
Thanks for your article,
I have this problem with SPRequestDuration on SP 2016 On-Prem, this server work about 1 year and no problem before 2 week ago, I maintenance Database (60GB is now) and check the resource that is not full load, even after restart the DB and SP server in not diffrent! I`m really confuse! Please Help me…
Saleh,
My apologies, but I cannot understand the latter part of what you wrote. I know that you’re in SharePoint 2016 on-prem farm, and it sounds like you are no longer getting SPRequestDuration response header served back to you on page requests. Is that correct?
I don’t have a SharePoint 2016 farm, but I just booted a SharePoint 2019 on-prem (VM) farm that I can. I checked a publishing portal site, and looking at the default.aspx page, I am getting all of the headers back: SPIisLatency, SPRequestDuration, and X-SharePointHealthScore. I’m unaware of any on-prem patches our cumulative updates that introduced changes to this behavior for any of the on-prem servers, so I’m not quite sure why things changed for you. Naturally, I wouldn’t expect them to simply change.
Any chance you can send me some screen shots or collected traces from Fiddler or IE/Chrome debugging tools? Most of the time, these traces will have a .saz or .har extension. If you’re willing to share those, I might be able to figure out what’s going on.
In the meantime, I hope things have managed to return for you. If they haven’t, maybe we can work through it.
Best of luck!
– Sean
Sean,
Thanks for your reply. my problem is solved. the problem occur in solution that we are create for Menu is SP, and when the code of that is correct, the speed of page be normal!
Saleh,
I’m glad to hear that you solved your problem! Lots of times custom development introduces unexpected “changes” and modifications to the operations of SharePoint. Kudos to you for figuring out the source of the problem and fixing it!
If I can ever be of assistance, feel free to reach out again. I’m normally a bit quicker on the replies to comments, and I’m sorry about the amount of time it took to originally get things approved and for me to respond.
Have a great day :)
– Sean